Test Dashboard
VVV Analysis
The VVV Scoring Dashboard covers the Value, Velocity, and Volume Analysis of the business per transaction usage. There could be ‘n’ number of business processes in a system. This dashboard identifies the critical business processes and prioritizes the test cases which must be tested based on the following factors:
Value
This score denotes the merit and significance of the transactional execution for the business scenario.
Volume
This score denotes the magnitude of the data and documents obtained from the transactional execution of the business scenario.
Velocity
This score denotes the frequency of the transactional execution for the corresponding business scenario.
KTern automatically analyses each transaction based on its value, volume and velocity and assigns a score between 1 and 10. Based on the VVV scores, KTern derives the materiality score for the business processes. The materiality score signifies the overall business value derived for the respective transaction. Higher the score, higher is the relevancy of the business process and vice versa. While auto-generating the test case recommendations, KTern assigns the priority of each test case based on this VVV-based materiality score.
Since testing is a very manual effort, there are chances that execution of certain test cases might be skipped with time as a factor. In such cases, KTern dashboard enables the project managers and test managers to prioritize the most significant test cases for testing and not miss out on any critical test case. This ensures that all the critical business processes are tested before going live with the production environment, thereby enabling a smooth transition to S/4HANA.
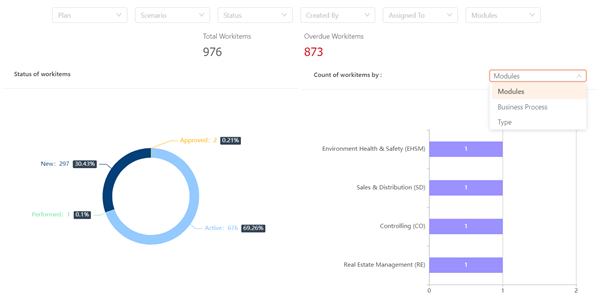
Status of Work Items
In KTern Dashboard, you can also find the breakdown of test cases and defects by status. It gives a graphical representation of the new, active, performed and approved test cases/defects. It also represents the split of these work items by modules, business process and type of testing.
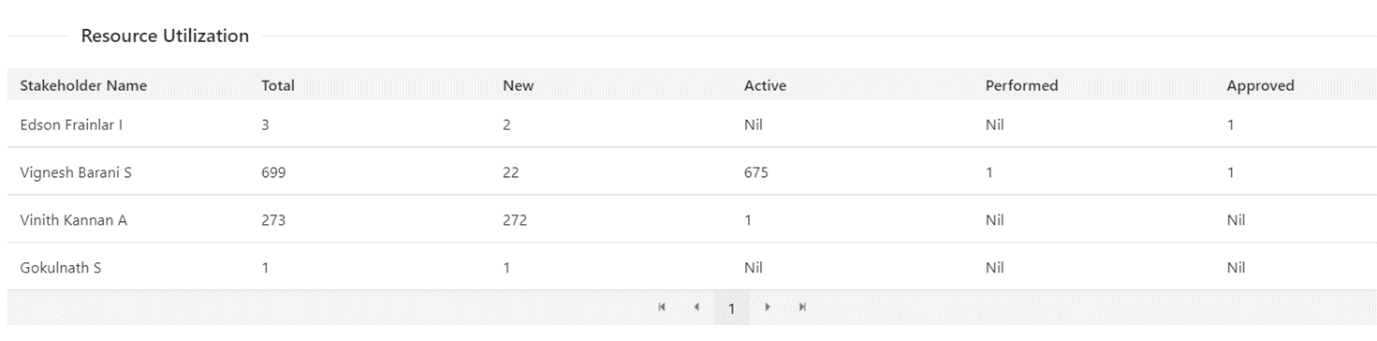
Resource Utilization Table
This table provides an overview of all the stakeholders and testers involved in the project. It has a list of all the testers working in the project along with the number of test cases allocated to them. It also tracks the progress of each stakeholder with respect to test case execution.
Thus, the test suite dashboard becomes the one dashboard using which the project manager can monitor all the test cases and progress of testing process as a whole, in the project.